 Reliax
1How to read this page
The summary is the panel above. The rest shows where each number comes from, in the order a reader new to the subject needs: the two datasets (section 2), the solution and why it adds something over the model's own confidence (section 3), the results problem by problem with both datasets side by side (section 4), the limits (section 4.5), the test fixed in advance on two sealed datasets (section 5), and the same guarantee placed on the lender's own cut-off (section 6). Anything technical is in the annex. Every "Show" line opens a detail, a full table or a figure; nothing behind them changes a conclusion.
2The two use cases
We evaluate on two public credit datasets because they have real outcomes, anyone can rerun them, and together they show the two situations a lender can be in. On the first, the model's probabilities are already accurate: when it says 20% risk, about 20% of such cases do default. On the second, they are not: the model's probabilities are too extreme. Where it says under 5% risk, about 15% of applicants turned out bad; where it says over 90%, about 70% did. This is a model trained on only 500 applicants. The first shows what Reliax adds when nothing is wrong; the second, what it adds when something is.
| Taiwan | German | |
|---|---|---|
| The decision | Will this credit-card holder default on next month's payment? | Is this loan applicant a good or a bad credit risk? |
| Applicants | 30,000 | 1,000 (small: some results are indicative only) |
| Share of bad outcomes | 22.1% default | 30% bad |
| What the model sees | 20 fields about credit limit, bills and payments. | 56 fields about the loan, the account and the applicant's history. |
| What it does not see | Sex, age and marital status. A lender may not decide on them, so they stay out of the model. They are used outside it: to audit the model group by group and, if the lender chooses, to build the guarantee per group (section 4.3). | Sex, personal status and age, for the same reason. |
| Groups audited | Sex; age bands 21-30, 31-45, 46+ | Sex |
| The model | Gradient boosting we trained to stand in for a lender's model: AUC 0.777; at the 0.5 cut, F1 0.47 (precision 0.68, recall 0.36) | Same method: AUC 0.769; F1 0.53 (precision 0.60, recall 0.48) |
Sources: Default of Credit Card Clients (Yeh & Lien, 2009; UCI 350) and Statlog German Credit (UCI 144), both CC BY 4.0 and shipped with the code. Protected attributes never enter the model. They are used to audit it and, if the lender chooses, to build the guarantee per group.
3The solution
3.1The technology, in plain words
In this work, Reliax builds on a family of methods called conformal prediction. The idea is simple enough to state in four steps.
- Take past decisions with known outcomes that the model did not train on. This is the calibration data.
- Measure how wrong the model is on each of them. For each past decision, one minus the probability the model gave to what actually happened.
- Pick the threshold from those errors. Sort them from smallest to largest and take the value that 95% of them stay below. That value is the threshold. The 95% (0.95) is a parameter the lender sets.
- For a new decision, check each possible outcome against the threshold. In credit there are two outcomes, repay or default. There is no outcome to compare with yet, so for each one take the error the model would make if that outcome turned out to be the true one: one minus the probability it gives that outcome. An outcome whose would-be error stays below the threshold is kept; call the kept outcomes the guaranteed set. If exactly one outcome is kept, that is the model's answer, and it is guaranteed. If both are kept, the model cannot separate them for this case; if neither is, this case does not look like anything in the calibration data. In both of those cases a person decides.
What is proven: on data like the calibration data, the guaranteed set contains the true outcome at least 95% of the time, for any model and any size of data (Vovk et al., 2005). That is a property of the procedure over many decisions, never a probability for one applicant. We do not take it on faith: we count it, on held-out applicants, in section 4.1.
How much calibration data is enough? In our evaluation, coverage varied by ± 0.004 across runs on Taiwan, which has 7,500 calibration decisions, and by ± 0.017 on German, which has 250. That is the general rule: the 95% floor holds whatever the size, but the more calibration data there is, the more certain you can be that the coverage you actually get sits close to the 95% you asked for, and the theory says by how much (Vovk, 2012; Angelopoulos and Bates, 2023). This link is a theorem, not something we fitted on our data: once the calibration data is fixed, the coverage on future decisions follows a known distribution (a Beta distribution) that depends only on the number of calibration decisions and on the target, not on the model or the dataset. Both references give the formula. At a 95% target, 250 calibration decisions give coverage somewhere between 0.93 and 0.97 in nine draws out of ten; 1,000 give 0.94 to 0.96; 7,500 give 0.946 to 0.954. That is why the evidence record states the size of the calibration data behind every guarantee, and why the German results are marked indicative.
Four more pieces use the same calibration data.
- Per group. The threshold can be set inside each audited group, so the guarantee holds for each group and not only on average (section 4.3).
- The probability bracket. For each prediction, two calibrated probabilities computed from the calibration data that bracket the model's single probability (Venn-Abers). A wide bracket means the calibration data does not support the model's number (section 4.2).
- The input check and the drift test. Both start from one number per input: its distance to the calibration data. That is the average distance to its 10 nearest calibration decisions, taken across all the fields the model sees, each field first put on the same scale. To know what counts as far, the same distance is computed for every calibration decision against the others, leaving itself out. That gives a reference list of normal distances. Input check: an input that sits farther than almost all of that list is one the guarantee does not cover, and a person decides. That says nothing about whether the model is right on it, only that there is no evidence either way. Drift test: across many decisions, the same distances are watched together. If nothing has moved, a new input is equally likely to fall anywhere in the reference list; if new inputs keep landing near the far end, the population has moved. The test keeps a running score of that evidence and raises an alarm when the score crosses a fixed line. If nothing has moved, the chance that the score ever crosses the line, over the whole life of the stream, is at most 1% (section 4.4 shows how).
- The outcome check. The evidence record makes two claims that outcomes can later confirm: that the guaranteed answers contain the true outcome 95% of the time, and that the model's probabilities are off by a stated amount. When outcomes land, both are recomputed on the new decisions and compared with what was claimed. Once their outcomes are known, those same decisions can refresh the calibration data; that is how the guarantee is recalibrated after a drift (annex B).
3.2Why not just use the model's confidence?
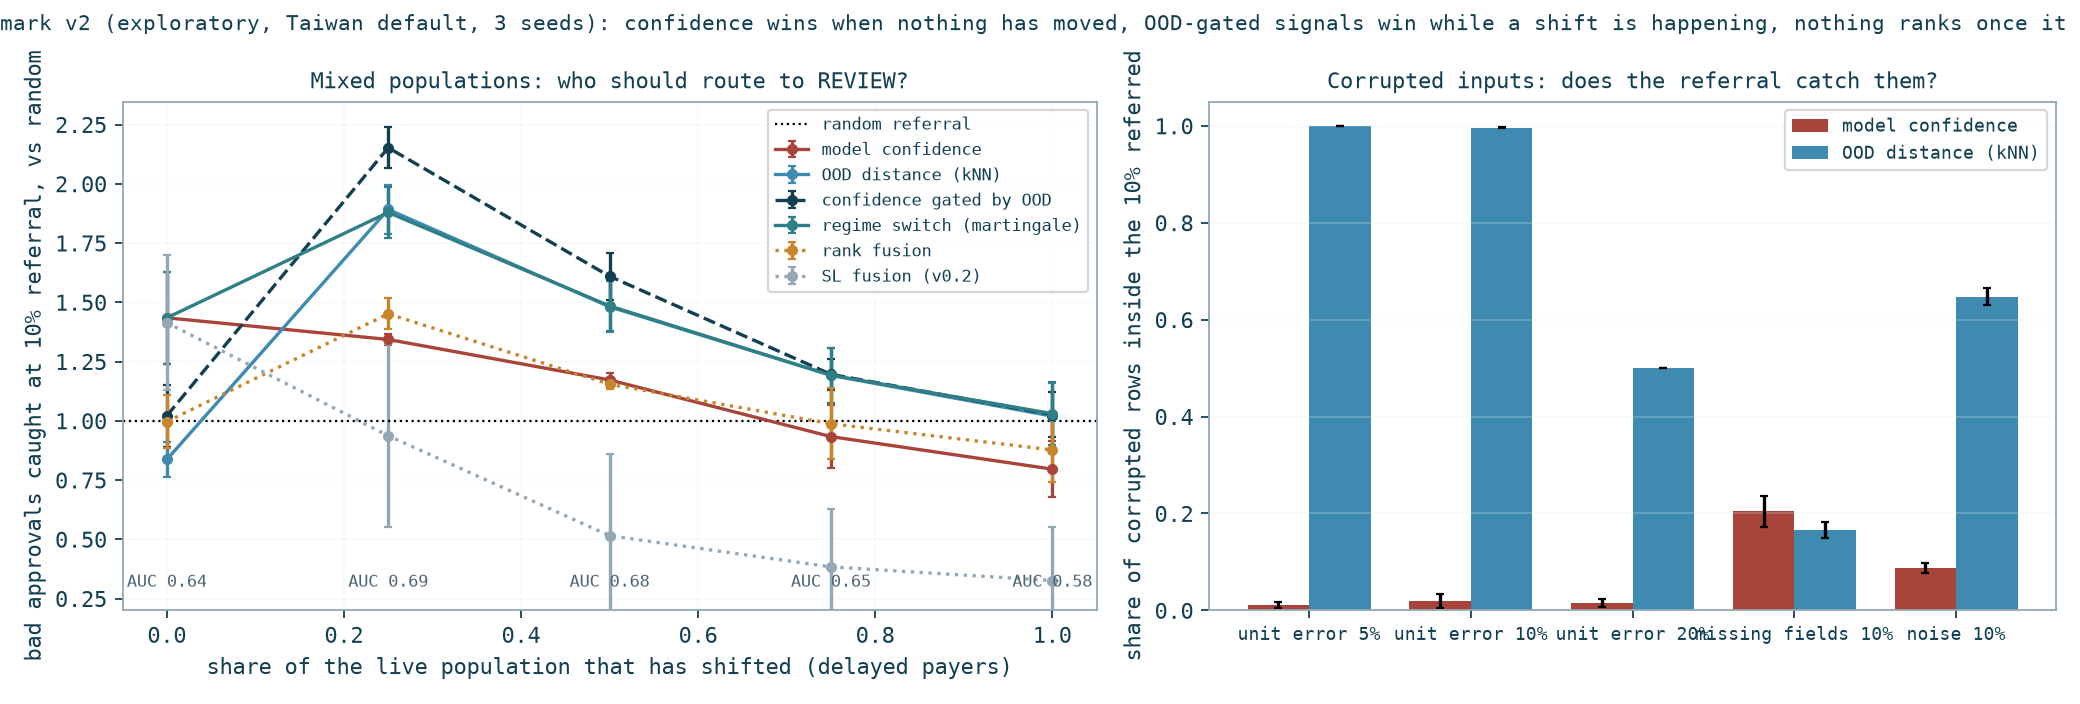
Because on a stable population the model's confidence is a good filter, this is the right question. Ranking decisions by confidence and reviewing the least confident catches about 2.2 times the mistakes that reviewing at random does, and no signal in Reliax beats that on stable data (section 4.5). On a population that is moving, the picture changes. On applicants unlike any it has seen, the model's confidence falls far less than its accuracy (Ovadia et al., 2019), so confidence loses part of its ordering. In an early test with one applicant in four drawn from a shifted population, reviewing first the inputs the guarantee did not cover caught 2.15 times the bad approvals of random review, against 1.34 for confidence (annex B; one dataset, three runs, exploratory). The guaranteed answer alone still ties with a confidence cut at the same review rate under shift (section 4.1); the gain comes from the input check, and from a review share that rises by itself. What the guarantee adds is everything the confidence cannot say.
| The model's confidence | The Reliax guarantee | |
|---|---|---|
| What it is | A number the model produces about its own answer. | Evidence computed from past decisions with known outcomes. |
| Error rate | None stated. 0.91 does not tell you how often decisions at 0.91 are right. | Guaranteed: at least 95% of guaranteed answers are right, on data like the calibration data. Checked by counting. |
| The threshold | Hand-picked. | Set from the data to meet the target the lender chose. |
| A right and a wrong answer | Look the same: 0.91 either way. | Still cannot be told apart one by one, but the evidence record says whether this answer is inside the guarantee: guaranteed, and then no more than 5% of such answers are wrong, or not guaranteed, and a person decides. |
| Per group | One number for everyone. | The guarantee can be checked and issued per audited group. |
| When the world changes | Accuracy falls far faster than confidence (Ovadia et al., 2019). Nothing in the output says so. | The share sent to a person rises by itself (26% to 48% under a real shift). The drift test alarms, with false alarms bounded by a theorem. The coverage loss is measured, and recovered by rebuilding the threshold from recent decisions with known outcomes: the same 95% guarantee, now about the new population. The model is untouched. |
| Later, in front of an auditor | A number in a log. | A record of what was guaranteed, from which data, and why the decision was routed as it was. |
| What it needs from the model | Nothing: it is part of the model's output. | Only the model's probabilities. It does not need the model's code, weights or training data, and the model is not retrained. |
3.3Reliax, and how it fits
Reliax sits beside the lender's decision engine. It receives each decision as the model scores it, issues the evidence record, and stores both. Three things go in, four things are assessed for every decision, and four things come out.
Protected attributes never enter the model. They are used to audit it and, if the lender chooses, to build the guarantee per group. When outcomes land, they are checked against what the evidence record claimed and can refresh the calibration data (the outcome check, section 3.1). The model is untouched throughout.
Two modes. In observe mode the decision engine keeps deciding as before; Reliax issues and stores the evidence record in parallel and enforces nothing, so a lender sees on real traffic what would have been sent to a person before anything changes. In gate mode the decision waits for its evidence record and the route is enforced: ALLOW proceeds, REVIEW and BLOCK go to a person before any action. Switching is a change of policy, not a new deployment.
What each route asks of you.
- ALLOW. The model's answer is guaranteed at the target rate and the input is within the guarantee. Your policy can act on it automatically. Nothing else is needed.
- REVIEW. The guarantee cannot single out an answer for this case: both outcomes were kept or neither, the bracket is wide, the input sits at the edge of the calibration data, or the calibration data is thin for this group. A person decides the case, with the model's answer and the evidence record in front of them. REVIEW says nothing about which way to decide, and the model's answer remains a legitimate input to the person's judgement.
- BLOCK. The guarantee does not apply to this input at all: the input sits far outside anything in the calibration data, or the drift test has reached ALARM, which suspends the guarantee for that segment. A person decides the case without leaning on the model's answer. BLOCK is also a signal about the system, not only about this case: it opens a check of the calibration data and, on ALARM, a recalibration.
Neither REVIEW nor BLOCK means the applicant is declined. Declining is always a person's decision, and the reasons given to the applicant come from your own model's reason codes, not from Reliax. The reason that fired is written in the record.
What an evidence record says. In words: "Prediction set {repay}, produced by a procedure that on the calibration set (7,500 rows, segment S) contains the true outcome at least 95% of the time. Input within the calibration data; no drift alarm. In this applicant's cell (same segment and score band; 412 of the 7,500 calibration decisions), the model's probabilities are off by 0.08. Routing: ALLOW under policy credit-pd-v4. This is not a probability that this case turns out well." The two counts differ on purpose: 7,500 is all the calibration data behind the coverage guarantee; 412 is the part of it that resembles this applicant, on which the error of the model's probability is measured. The record's last sentence matters: the 95% describes the procedure across many decisions, not this applicant, whose answer is simply right or wrong. For the same reason Reliax never shows a percentage next to a single decision, only the guaranteed set and the route; "this decision is 95% reliable" would be read as a personal probability, and it is not one.
3.4How we evaluated
Each dataset is split in three: half to train the model, a quarter as calibration data, a quarter held out to test on. Because one random split can be lucky, every experiment is repeated with different random splits, called seeds: 5 on Taiwan, 10 on German. A number written as 0.9515 ± 0.0040 is the average over those repeats and their spread. The coverage target is 95% throughout.
Two baselines: the model's own confidence, for anything about which decisions to send to a person; and temperature scaling, the standard method for correcting a model's probabilities, for anything about calibration.
4Results
All results in one table
| The problem | Taiwan · 30,000 applicants | German · 1,000 applicants |
|---|---|---|
| 1 · Can this answer be trusted? | Guarantee held: 0.9515 against a 0.95 target. Routing on it: bad approvals 138 to 41 per 1,000, wrong rejections 49 to 7, with 54% of decisions reviewed. | Guarantee held: 0.9532 against 0.95. Routing not measured: too few applicants to split further. |
| 2 · Can the probability be trusted? | The model's own probabilities were already well calibrated (0.013) and so were the brackets (0.016): they confirmed the model's numbers. The widest brackets carried 32% more errors. | Calibration error: model's own probabilities 0.186, brackets 0.065, probabilities rewritten by the standard fix 0.083. |
| 3 · Does it hold for every group? | Worst audited group (age 46+) at 0.945, within noise of the target. | Women at 0.943 with one threshold for everyone, 0.974 with a per-group threshold. 75 test cases per run: indicative. |
| 4 · What happens when the world changes? | 0 false alarms on 5 stable streams. A real shift caught in 4 of 5 streams. The review share rose by itself from 26% to 48%. | Not measured: too few applicants to form streams. |
Every cell is measured by the released code on held-out applicants. "Not measured" means the experiment was not run on that dataset, not that it failed.
4.1Can this answer be trusted?
Yes, at the guaranteed rate, on both datasets. On Taiwan, routing on the guarantee cut bad approvals from 138 to 41 per 1,000 and wrong rejections from 49 to 7, with 54% of decisions going to a person. The model's confidence would catch the same at that rate; Reliax adds the guarantee behind the threshold and a threshold that moves with the data.
Taiwan
First the guarantee itself. At a 95% target the guaranteed set contained the true outcome for 95.15% of held-out applicants, and at a 90% target for 89.97%. The 90% figure sits 0.03 points under its target. That is within what the theory allows: the guarantee holds on average over draws of the calibration data, and with 7,500 calibration decisions any one run can land a few tenths of a point either side (section 3.1). The guarantee does what the theorem says, on real applicants.
| Dataset | Target 1−α | Empirical coverage | Mean set size |
|---|---|---|---|
| Taiwan | 0.95 | 0.9515 ± 0.0040 | 1.49 |
| Taiwan | 0.90 | 0.8997 ± 0.0012 | |
| German | 0.95 | 0.9532 ± 0.0167 | |
| German | 0.90 | 0.8964 ± 0.0307 |
On average the guaranteed set listed 1.49 outcomes per applicant. In other words, at a 95% level the model could be relied on for about half of its decisions, and the other half went to a person. That share is set by how sharp the model is, not by Reliax: a modest model here (AUC 0.777), far less on a sharper one (annex B shows 1.5% to 74% across other tasks at the same target).
Then what routing on it does to the book, counted per 1,000 applications processed.
| Regime | Target | Coverage | REVIEW rate | Bad approvals per 1,000, model alone | Bad approvals per 1,000, auto-decided | Share of bad approvals caught by REVIEW | Same share, random referral at that rate | Same share, confidence cut at that rate |
|---|---|---|---|---|---|---|---|---|
| Unshifted | 0.95 | 0.952 | 54% | 138 | 41 | 0.70 | 0.54 | 0.70 |
| Unshifted | 0.90 | 0.901 | 26% | 138 | 83 | 0.40 | 0.25 | 0.40 |
| Utilisation shift | 0.95 | 0.903 | 32% | 148 | 85 | 0.42 | 0.33 | 0.42 |
| Utilisation shift | 0.90 | 0.856 | 16% | 148 | 114 | 0.23 | 0.17 | 0.23 |
| Payment-delay shift | 0.95 | 0.911 | 78% | 389 | 87 | 0.78 | 0.78 | 0.78 |
| Payment-delay shift | 0.90 | 0.774 | 48% | 389 | 215 | 0.45 | 0.48 | 0.45 |
| Regime | Target | REVIEW rate | Wrong rejections per 1,000, model alone | Wrong rejections per 1,000, auto-decided | Share of wrong rejections caught by REVIEW | Same share, random referral at that rate | Same share, confidence cut at that rate |
|---|---|---|---|---|---|---|---|
| Unshifted | 0.95 | 54% | 49 | 7 | 0.86 | 0.54 | 0.86 |
| Unshifted | 0.90 | 26% | 49 | 16 | 0.68 | 0.26 | 0.68 |
| Utilisation shift | 0.95 | 32% | 60 | 12 | 0.80 | 0.31 | 0.80 |
| Utilisation shift | 0.90 | 16% | 60 | 29 | 0.52 | 0.16 | 0.52 |
| Payment-delay shift | 0.95 | 78% | 73 | 1 | 0.98 | 0.78 | 0.98 |
| Payment-delay shift | 0.90 | 48% | 73 | 11 | 0.86 | 0.49 | 0.86 |
Read the first row of each table as a lender would. At the 95% target, 54% of decisions go to a person; among the rest, bad approvals fall from 138 to 41 per 1,000 and wrong rejections from 49 to 7. At the 90% target, 26% go to a person, and 83 and 16 remain. The lender chooses the target; the guarantee says what each choice costs and what it buys, before any decision is made.
The comparison that matters. Reviewing the same share of least-confident decisions would catch the same mistakes; the last two columns show it. The guarantee does not find mistakes the confidence cannot. What it adds is that the threshold carries a guaranteed error rate instead of being hand-picked, and that it moves by itself when the population shifts: in the shifted rows the review share rose from 26% to 48% at the 90% target without anyone touching a setting.
REVIEW and BLOCK mean a person decides. Nothing in these tables declines an applicant.
German
The guarantee held here too: 95.32% at the 95% target, 89.64% at the 90% target, with a wider spread because the calibration and test sets are small (250 applicants each per run), as the note in section 3.1 predicts. Routing was not measured on German: 1,000 applicants leave too few decisions once the data is split and repeated.
4.2Can the probability be trusted?
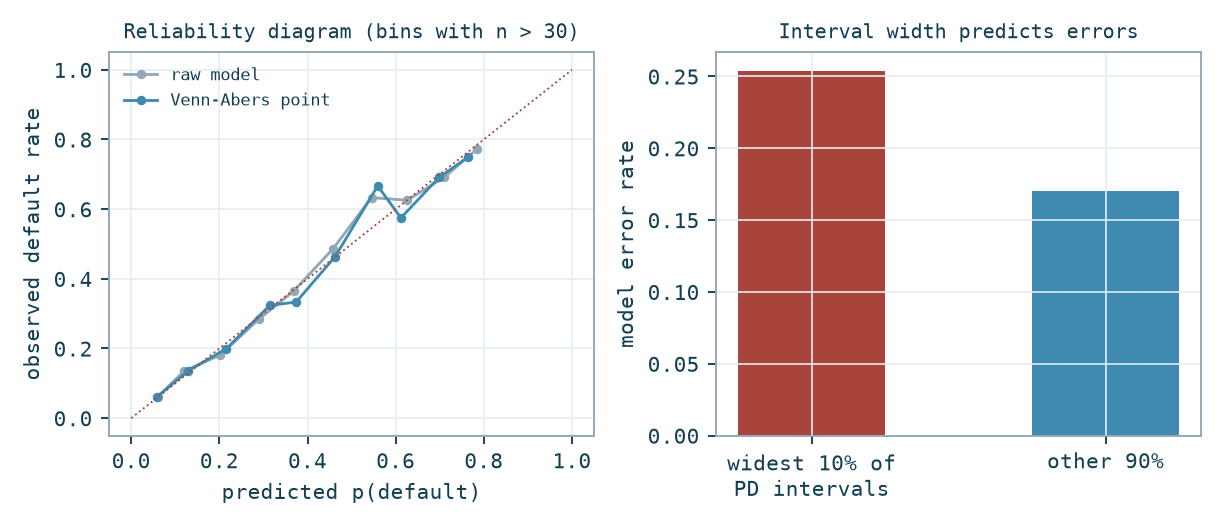
The bracket sits beside the model's probability; it does not replace it. Where the model's probabilities were already well calibrated, the brackets sat close around them and confirmed them (Taiwan: 0.013 for the model, 0.016 for the brackets). Where they were not, the brackets were better calibrated than the standard fix. Calibration error on German: model's own probabilities 0.186, brackets 0.065, probabilities rewritten by temperature scaling 0.083.
A model that says "20% risk" should be wrong about 20 times in 100 on cases it scores that way. The calibration error measures how far that is from true, in 15 bands of the model's score; zero is perfect. The standard fix, temperature scaling, rewrites the model's probabilities with one parameter. Reliax does not rewrite anything: for each prediction it reports two calibrated probabilities around the model's number, the bracket, computed from the calibration data. The width of the bracket says how far the calibration data supports the model's figure.
| Dataset | ECE, raw | ECE, temperature scaled | ECE, Venn-Abers | Fitted temperature |
|---|---|---|---|---|
| Taiwan | 0.0132 ± 0.0024 | 0.0127 ± 0.0024 | 0.0155 ± 0.0048 | 1.01 |
| German | 0.1862 ± 0.0171 | 0.0826 ± 0.0195 | 0.0649 ± 0.0181 | 3.99 |
Taiwan
The model's own probabilities were already well calibrated (error 0.013). The brackets were about as well calibrated (0.016), so they sat close around the model's numbers and confirmed them; the standard fix changed almost nothing either (0.013). The brackets still carried information: the 10% of applicants with the widest brackets had an error rate of 0.229 against 0.174 for the rest, 32% higher. A wide bracket on a decision is a warning in itself.
German
The model's own probabilities had a calibration error of 0.186. The probabilities rewritten by the standard fix had a calibration error of 0.083. The brackets, reported beside the model's number, had a calibration error of 0.065. A lender cannot know in advance which of the two situations they are in. A bracket that agrees with a calibrated model and is better calibrated than the standard fix on a miscalibrated one is the right default, and it leaves the model's own output untouched.
ShowHide Figure 4: the reliability diagram and the width effect
4.3Does it hold for every group?
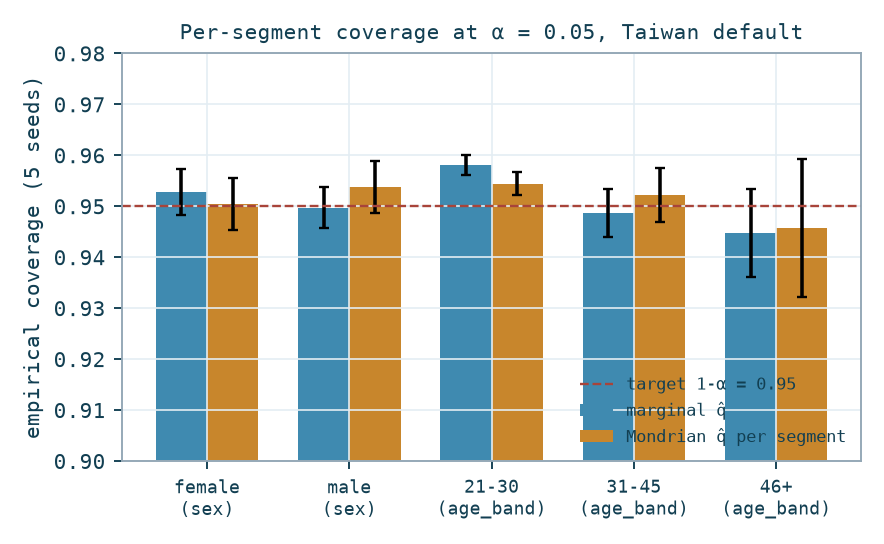
On these two datasets, no group was severely under-covered. The audit reports it per group; where a gap exists, the guarantee can be built per group. Annex B shows a dataset where the gap was real and was closed that way.
A guarantee that holds on average can fail for one group. The audit costs one extra pass over the calibration data and reports coverage per audited group. Where a group falls short, the guarantee can be built per group: the four steps of section 3.1 are run on that group's own calibration decisions, so it gets its own threshold and the guarantee holds inside the group by construction. A harder group gets a higher threshold and sends more decisions to a person; a group with too few calibration decisions is flagged as thin rather than guaranteed. The model is not touched; what changes is the evidence the lender holds for each group.
Does a per-group threshold make sense for an attribute the model never saw? Yes, and that is where it matters most. A model cannot adjust for an attribute it does not see, so nothing keeps its errors equal across the groups that attribute defines. In annex B, race and ethnicity were left out of the model, and with one threshold for everyone coverage was 0.924 for one group against 0.956 for another. Reliax would not know the difference in any case: it reads only the model's probabilities and cannot tell which features the model was trained on. The calibration data can also be more recent than the training data, so a group may behave differently now from how it did when the model was built; the per-group threshold follows the calibration data, not the training.
What a lender should weigh is how the attribute is used. The audit uses it after the fact, to measure. A per-group guarantee uses it at decision time, to pick the threshold that decides who goes to a person. That never changes the model's score and never declines anyone, but it is a use of the attribute in the decision flow, and it needs the attribute for every new applicant. Whether to do that is the lender's choice, under its own legal review. A lender that prefers not to keeps one threshold and uses the audit to see the gap.
Taiwan
| Segment (Taiwan) | n (test) | Coverage, marginal | Coverage, Mondrian |
|---|---|---|---|
| female | 4,481 | 0.9527 ± 0.0045 | 0.9505 ± 0.0051 |
| male | 3,019 | 0.9497 ± 0.0040 | 0.9538 ± 0.0051 |
| age 21-30 | 2,777 | 0.9581 ± 0.0019 | 0.9544 ± 0.0023 |
| age 31-45 | 3,552 | 0.9486 ± 0.0047 | 0.9522 ± 0.0053 |
| age 46+ | 1,171 | 0.9447 ± 0.0086 | 0.9457 ± 0.0136 |
No audited group was severely under-covered. The worst, age 46+, sat about half a point below target, within the spread of the runs. Building the guarantee per group changed little, because there was little to change.
German
With one threshold for everyone, women were covered 94.3% of the time; with a per-group threshold, 97.4%. With only 75 women per test run this is indicative, not a finding. The conclusion is modest: gaps depend on the dataset and cannot be assumed present or absent. The audit is what makes them visible; annex B shows a dataset where they were real.
Where this is heading. Today the guarantee is checked per group, for the few groups a lender chooses to audit. The goal is finer than that: the same kind of guarantee for many groups at once, including ones that overlap, so that it comes as close as the mathematics allows to holding for each person. It cannot hold for every individual, no method can do that (Barber et al., 2021), but recent work shows how to get close (Gibbs, Cherian and Candès, 2023). That is future work and is not claimed here.
ShowHide Figure 2: coverage per group, one threshold against per-group thresholds
4.4What happens when the world changes?
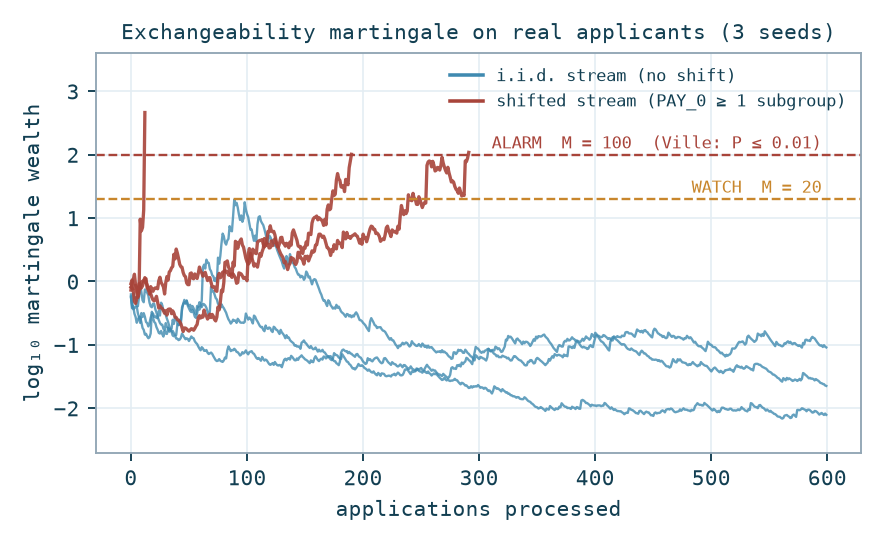
Zero false alarms on stable streams; a real shift caught in 4 of 5 streams. Under shift the share sent to a person rises by itself, and the coverage loss is measured rather than hidden.
What drift is. The model was built on last year's applicants. This year's may differ: the economy turns, a new channel brings new customers, a data feed changes. The model keeps answering with the same confidence, because nothing in it knows the world moved; only its accuracy falls. Drift is that change in the incoming population. Reliax watches it twice: on the inputs as they arrive, and on the outcomes once they land.
Moved since when? Reliax measures the move against the calibration data, because the guarantee is built from it. On first deployment that is also the population the model was trained on, so an alarm says two things at once: the model is on unfamiliar ground, and the guarantee no longer applies. After a recalibration the two part: the guarantee is rebuilt on the new population, while the model is still the one trained on the old.
Taiwan
We drew streams of 600 real applications from the held-out set. Stable streams were sampled at random, with replacement. Shifted streams were sampled from a real subgroup, applicants already behind on a payment (22.4% of the book), also with replacement, so the shift is real, not simulated.
| What we measured | Result |
|---|---|
| False alarms on i.i.d. streams (5 seeds × 600 applications) | 0 / 5 (max log₁₀ M = 0.22 ± 0.56) |
| Streams reaching ALARM under shift | 4 / 5 within 600 applications |
| Applications to ALARM, when reached | 192 ± 110 |
| PSI on the shifted window, top features | PAY_0: 7.37 · PAY_2: 1.11 · PAY_3: 0.64 (all MAJOR) |
No stable stream raised an alarm. The theorem bounds the chance that a stable stream ever does at 1%, over its whole life. That is not one decision in a hundred; the box below explains. Four of the five shifted streams reached ALARM within 600 applications, after 192 on average. The fifth had not alarmed by 600: a milder shift takes longer, which is how an evidence-accumulating test should behave. The PSI row is a separate diagnostic. The population stability index compares one field at a time between the calibration data and the incoming window and says which fields moved, here the payment-status fields; by the usual convention a value above 0.25 is a major shift. It does not feed the alarm.
ShowHide how the drift test works, in four steps
- One number per application. Each field is put on the same scale, and the application's distance to the calibration data is measured: the average distance to its 10 nearest calibration decisions. All the fields count together in that one distance. There is no separate test per field to combine afterwards.
- Rank it. The distance is compared with the reference list of section 3.1: the same distance for every calibration decision against the others. The result is the share of calibration decisions that sit at least as far, a number between 0 and 1, with ties broken at random. If nothing has moved, that number is equally likely to fall anywhere between 0 and 1.
- Keep score. The test starts with a score of 1, and every application multiplies it: by more than 1 when the application is unusually far, by less than 1 when it is ordinary. One of the bets it places multiplies the score by 5 for an application farther than 99% of the reference list, and by 0.7 for one in the middle. The score is the average of 19 such bets, from cautious to aggressive, so that slow and sudden shifts are both picked up. On a stable population the multipliers average exactly 1, so the score has no tendency to grow, and in practice it sinks. On a shifted one they compound.
- Compare with the line. WATCH when the score reaches 20, ALARM when it reaches 100. A theorem (Ville, 1939; Vovk et al., 2003) says that a score built this way reaches 100 with probability at most 1 in 100 if nothing has moved, however long the stream runs and however often it is looked at. The line is a setting: at 1,000 the chance falls to 0.1%, and detection takes longer.
How this relates to the check on single inputs. The same distance feeds both. One application far outside the calibration data is stopped on its own by the input check. Many applications that are each only somewhat far, none of them stopped, raise the alarm together.
What the 1% does not cover. It is a budget per stream. A lender watching 50 segments holds 50 such budgets, and a new one starts after each recalibration.
The guarantee also moves on its own under shift. On the shifted rows of the routing tables above, the share sent to a person rose from 26% to 48% at the 90% target and from 54% to 78% at the 95% target, because shifted applicants fall below the guaranteed threshold. Coverage fell too (from 0.952 to 0.911 at the 95% target), which is the expected loss when the population moves; the fix is to recalibrate the guarantee on recent decisions, and annex B measures that repair on 92 weeks of real lending.
ShowHide Figure 3: the drift test on stable and shifted streams
German
Not measured: 1,000 applicants are too few to form streams of 600 once the data is split.
4.5Where the value stops
- Not a better filter on stable data. Ranking decisions by the model's confidence catches about 2.2 times the mistakes of random review; every Reliax signal ties with it or trails it on stable data. The one exception is a small second model that learns the base model's past mistakes: it catches 18.3% of wrong approvals in the 10% it refers, against 17.2% for confidence. The full table is in annex A.
- The calibration data is a requirement. The guarantee needs a few thousand past decisions with known outcomes, drawn from the population the model serves and kept out of its training. In credit, outcomes arrive late, so the deployment starts on 30, 60 and 90-day delinquency and recalibrates as defaults land. After a drift the calibration data must be refreshed; until then the evidence record says the guarantee is suspended. A lender can start in observe mode with no outcomes at all: the input check, the drift test and the record need none. Annex D covers the case where the training labels themselves are wrong.
- The review share is the model's number. 54% at the 95% target on Taiwan reflects a modest model. The lender has two levers, both theirs: a lower target or a better model.
- The guarantee is over a calibration set, not for one person. "95% of decisions like this" is a property of the procedure. Reliax never prints a percentage beside a single decision.
- Small data is indicative. German credit is small and its sex attribute also encodes marital status; its group results are indicative only.
- These are our own measurements. The code and data are public so that anyone can rerun them. How the advisory criticality score behaves under drift was the subject of a pre-registered test, run in October 2026 on two sealed datasets: it did not pass (section 5). It stays advisory, and never decides a route.
5The pre-registered test
Two more credit datasets were kept sealed from the start of this work: Give Me Some Credit (Kaggle, 2011) and Home Credit Default Risk (Kaggle, 2018). The test, the pass mark, the way each dataset is split and the code that runs it were written down and published before either dataset was downloaded (the evaluation repository's pre-registration, Amendment 1 and its acceptance on 17 October 2026). The datasets were then opened and the test run once. The result is reported as it came out: the pass mark was missed.
5.1What was fixed in advance
For each dataset a reference population and a shifted one were declared: borrowers with no late payment, and borrowers with one. The model and the calibration data come from the reference population only. Streams of 4,000 decisions then arrive with a growing share from the shifted population, and other streams carry a unit error (monetary amounts multiplied by 100, a currency or cents bug). Every claim was measured over five runs.
| Stream | What arrives | What was claimed |
|---|---|---|
| Moderate shift | 25% and 50% of decisions from the shifted population | Sending first to a person the 10% of decisions whose inputs sit farthest from the calibration data catches at least 1.5 times the bad approvals of random review, and more than the model's own confidence does (95% interval above 1), at both shares and on both datasets. A share that costs the model under 3 AUC points does not count: the shift is too mild to test anything. |
| Severe shift | 75% and 100% | The drift test alarms in every run, and the share sent to a person rises. |
| Unit error | 5% and 10% of decisions with amounts x100 | The 10% sent to a person hold at least 80% of the corrupted decisions, and the drift test alarms in every run. |
| Give Me Some Credit | Home Credit Default Risk 2018 | |
|---|---|---|
| Applicants | 150,000 borrowers; 6.7% seriously delinquent within two years | 307,511 applicants; 8.1% default |
| Shifted population | Borrowers 30 to 59 days late at least once. The model sees that count. | Applicants with any late payment in their credit-bureau history. The model does not see the bureau data. |
| The model | Gradient boosting on 9 fields, trained on 8,000 borrowers: AUC 0.801 on a random split of everyone | Same method, on the numeric fields of the application: AUC 0.679 |
| Not seen by the model | Age | Sex, age and family status |
The model is deliberately plain and the same for every dataset, fixed before the data was seen; section 5.4 repeats the test on a model built the way a credit team would build it. Accuracy is not reported as a model measure: with 6.7% of borrowers delinquent, approving everyone already scores 93%, and this model scores 93.1%.
5.2Results
| Stream | Give Me Some Credit | Home Credit Default Risk 2018 |
|---|---|---|
| No shift | Coverage 95.1% at a 95% target; 1.1% sent to a person | Coverage 95.0%; 15.5% sent to a person |
| Moderate shift, 25% | 3.99 times random review and 1.33 times confidence (interval 1.19 to 1.73), but the shift costs the model 2.5 AUC points: too mild to count. Not met | 1.60 times random review, but 0.66 times confidence (interval 0.59 to 0.87): worse than the model's confidence. Not met |
| Moderate shift, 50% | 2.77 times random review, 1.19 times confidence (interval 1.12 to 1.49). Met | 1.44 times random review, 0.67 times confidence (interval 0.56 to 0.86). Not met |
| Severe shift | Drift alarm in 5 of 5 runs, within about 5 to 7 decisions. Coverage falls to 81% and 77%; the share sent to a person rises from 1% to 4% and 5%. Met | Drift alarm in 3 of 5 runs at 75% and 4 of 5 at 100%, after about 1,400 decisions; coverage barely moves (95% to 94%). Not met |
| Unit error, 5% and 10% | 95% and 82% of the corrupted decisions caught (confidence: 5%); alarm in every run. Met | 100% and 95% caught (confidence: 3% to 4%); alarm in every run. Met |
Pass mark: met at both moderate shares on both datasets. It was not. Taiwan, run through the same code but not part of the test because it shaped it, meets every line. Intervals are 95% paired bootstrap intervals on the first run, as fixed in advance.
5.3What it means
- Data errors are caught. On all three datasets, inputs with a unit error land in the share sent to a person, where the model's confidence lets almost all of them through.
- A shift that shows in the inputs is caught fast. On Give Me Some Credit the drift test alarmed within a handful of decisions, which matters: there the guarantee really broke (coverage 77% to 81%), and the alarm is what suspends it.
- A shift that does not show in the inputs is caught late, or not at all. On Home Credit the late payers are defined by bureau data the model never sees; in the application fields they look ordinary. Nothing that reads the inputs can see such a shift. What catches it is the outcome check, once defaults land, and recalibration (annex B, Home Credit 2024).
- Ranking by how unusual an input is does not reliably beat the model's confidence. It helped on Give Me Some Credit and Taiwan and hurt on Home Credit. As fixed in advance, it stays advisory: it orders the queue a person works through and never decides a route.
5.4On a production-grade model exploratory
The test above uses a deliberately plain model. To see whether the guarantee behaves the same on top of a model a credit team would deploy, the same streams were rerun with all of the reference population for training, a tuned gradient boosting with early stopping and, on Home Credit, the categorical fields, the usual ratio features and the credit-bureau history. This was written down after the test above was seen (Amendment 3), so it is exploratory: it changes nothing in section 5.2. Each cell reads plain model → production-grade model.
| Taiwan | Give Me Some Credit | Home Credit Default Risk 2018 | |
|---|---|---|---|
| Model, random split of everyone | AUC 0.756 → 0.782 | AUC 0.801 → 0.856 | AUC 0.679 → 0.758 |
| At the cut that maximises F1 | F1 0.54: precision 0.51, recall 0.58 | F1 0.42: precision 0.39, recall 0.46 | F1 0.31: precision 0.25, recall 0.40 |
| Coverage, no shift / full shift | 94.9% / 91.1% → 95.2% / 95.6% | 95.1% / 77% → 95.2% / 74% | 95.0% / 94% → 94.9% / 94% |
| Sent to a person, no shift | 54% → 47% | 1.1% → 3.4% | 15.5% → 11.9% |
| 25% shift: vs random review / vs confidence | 2.16 / 1.57 → 2.33 / 1.18 (interval 1.08 to 1.30) | 3.99 / 1.33 → 4.54 / 0.95 (interval 0.85 to 1.05) | 1.60 / 0.66 → 2.35 / 0.70 (interval 0.56 to 0.86) |
| 50% shift: vs random review / vs confidence | 1.51 / 1.34 → 1.40 / 1.11 (interval 0.99 to 1.21) | 2.77 / 1.19 → 3.15 / 0.98 (interval 0.90 to 1.03) | 1.44 / 0.67 → 2.67 / 0.89 (interval 0.73 to 1.01) |
| Drift alarm, full shift | 5 of 5 runs, about 6 decisions → the same | 5 of 5 runs, about 5 to 7 decisions → about 4 | 4 of 5 runs, about 1,400 decisions → 5 of 5, about 1 decision |
| Unit error caught, 5% / 10% | 100% / 84% → 100% / 80% | 95% / 82% → 96% / 68% | 100% / 95% → 100% / 83% |
Accuracy is left out on purpose: with 6.5% to 22% of borrowers defaulting, approving everyone already scores 78% to 93%. A better model does three things. It ranks risk better on its own, so the gain from reviewing the unusual inputs first, over the model's confidence, shrinks or disappears: on the production-grade model it no longer beats confidence on Give Me Some Credit or Home Credit. With the credit-bureau history in the model, the Home Credit shift now shows in the inputs and the drift test catches it at once. And the guarantee still needs the drift alarm: on Give Me Some Credit coverage falls to 74% under the full shift, and the alarm is what suspends it. The share of unit errors caught at 10% corruption falls on Give Me Some Credit (82% to 68%); it stays above the model's confidence (10%), but under the 80% mark of section 5.1.
6The guarantee at the lender's own cut-off exploratory
A lender does not decide at a 95% coverage target. It approves when the predicted risk is below its break-even point: with a margin M on a good loan and a loss L on a default, lending pays when the default probability is below PD* = M / (M + L). With M = 600 and L = 5,000, PD* is 10.7%. The lender keeps that cut-off. What Reliax can add is a proof that the decisions on each side of it are on the right side, and a person for the ones that cannot be proven. This section asks whether that costs margin. It was written down after section 5 was seen (Amendments 4 and 5), on the production-grade model of section 5.4, so every figure is exploratory. Each is the mean of five runs on held-out test rows.
6.1Routing at the cut-off
Three ways of deciding the same test rows are compared: the lender alone (approve below PD*, decline above, nobody reviews); routing on the 95% guaranteed set of sections 4 and 5 (one outcome left: decided automatically; both left: a person); and the bracket of section 4.2 against PD* (approve when the whole bracket is below PD*, decline when it is all above, a person only when it straddles PD*). The margin counts +600 for each approved good customer and −5,000 for each approved default.
| Taiwan | Give Me Some Credit | Home Credit Default Risk 2018 | |
|---|---|---|---|
| Lender alone: approved / declined | 33% / 67% | 84% / 16% | 77% / 23% |
| 95% guaranteed set: sent to a person, margin given up | 47%; −44% | 3.4%; −14% | 12%; −6% |
| Bracket against PD*: sent to a person, margin given up | 2.0%; −1.1% | 0.6%; −0.8% | 0.6%; −0.1% |
| Default rate among automatic approvals: lender alone / bracket | 7.0% / 6.6% | 2.7% / 2.7% | 4.6% / 4.7% |
The 95% set is built to contain the true outcome, not to respect the lender's economics, so it approves people above the break-even point and sends many good decisions to a person. Measured against the lender's own cut-off instead, under 2% of decisions go to a person and about 1% of the margin is given up at most. Calibrating the bracket separately for near, middle and distant inputs (thirds of the calibration set by distance) changed none of this.
6.2A guaranteed cut-off
A lender may instead fix a target: no more than a given default rate among approvals. The usual way is to pick the loosest cut-off whose default rate on past data meets the target. Reliax picks the loosest one it can prove meets the target, with 95% confidence, by testing candidate cut-offs in a fixed order from the safest (a Learn-then-Test procedure with exact binomial bounds). Both were drawn 100 times per dataset from fresh splits of the calibration and test rows, with the target set at half the base default rate.
| Target: half the base rate | Taiwan (target 11.2%) | Give Me Some Credit (3.4%) | Home Credit (4.1%) |
|---|---|---|---|
| Usual cut-off: approvals above target on the test rows | 57% of draws | 52% of draws | 59% of draws |
| Guaranteed cut-off: approvals above target | 10% of draws | 6% of draws | 19% of draws |
| Guaranteed cut-off: share approved | 59% | 86% | 64% |
The usual cut-off misses its own target about half the time, as it must: it is fitted to the past data. The guaranteed one misses it rarely. The guarantee allows 5% of draws, and Taiwan (10%) and Home Credit (19%) exceed it. Part of that is how a miss is counted: a draw counts as one when the default rate on the test rows, which are finite, comes out above the target, even where the true rate is below it. On Home Credit the guaranteed cut-off sits close to the target (3.7% among approvals against 4.1%), where that noise matters most. The draws also share one model and one pool of rows, so they are not independent. At three quarters of the base rate the guaranteed cut-off missed in 1% (Taiwan), 0% (Give Me Some Credit) and 14% (Home Credit) of draws.
6.3Both sides guaranteed: approve, review, decline
A guarantee only on approvals leaves declines unchecked, and a wrong decline is a good customer lost. So the calibration scores are cut into 20 equal slices, and two fixed-order tests are run, each at 2.5%: from the safest slice up, each slice is approved automatically only if its default rate is proven at most PD*; from the riskiest slice down, each is declined automatically only if its default rate is proven at least PD*. The slices neither test can settle go to a person. Jointly, with 95% confidence, every automatic approval comes from a slice that defaults at most PD*, and every automatic decline from one that defaults at least PD*.
| M = 600, L = 5,000 | Taiwan | Give Me Some Credit | Home Credit Default Risk 2018 |
|---|---|---|---|
| Approved / sent to a person / declined | 13% / 39% / 48% | 80% / 6% / 14% | 64% / 19% / 18% |
| Default rate: approvals / person / declines | 5.6% / 10.3% / 36% | 2.4% / 10.0% / 29% | 3.7% / 10.0% / 22% |
| Margin of automatic decisions, against the lender alone | −45% | −1.4% | −4.1% |
| Re-draws where approvals came out above PD*, or declines below it | 0 of 100 | 0 of 100 | 0 of 100 |
| Under the moderate shift (25%), margin against the lender alone | +14% | +2.6% | −0.4% |
The cases sent to a person default at about PD*, 10%: exactly the ones where lending is a coin toss for the lender. How many there are depends on the model and on the calibration data, not on Reliax: 6% on Give Me Some Credit, where the model separates risk well and 10,000 past decisions are available, 39% on Taiwan, where the model is weaker and the calibration set has 5,000. With 10 slices instead of 20, Taiwan sends 28% to a person and gives up 17% of the margin. Under the shift no guarantee is claimed, yet the margin of automatic decisions held or rose on Taiwan and Give Me Some Credit, because the zones approve fewer of the cases that turn out bad (6.5% against 9.1% defaults among Taiwan's approvals). With a thinner margin (M = 300, PD* 5.7%) the share sent to a person rises (21% on Give Me Some Credit, 29% on Home Credit), and on Taiwan nothing can be approved automatically at all.
6.4What it means
- The guarantee can sit on the lender's own cut-off. The lender keeps its economics; Reliax proves which decisions are on the right side of it, on both sides, and sends the rest to a person.
- At a good model it costs little. On Give Me Some Credit, 6% go to a person and 1.4% of the margin is given up; routing on the 95% set gave up 14%.
- At a weak model it costs a lot, and shows it. On Taiwan the band nobody can prove is wide. That is a finding about the model, made visible before the lender relies on it.
- None of this is pre-registered. It was designed after section 5 was seen and is reported to show the direction. A test fixed in advance, on a lender's own decisions, is the next step.
AAnnex
Everything below is for readers who want the detail. Nothing in it changes the results above.
A. Detailed tables and figures
ShowHide Ranking mistakes on stable data: every signal against the model's confidence (Taiwan)
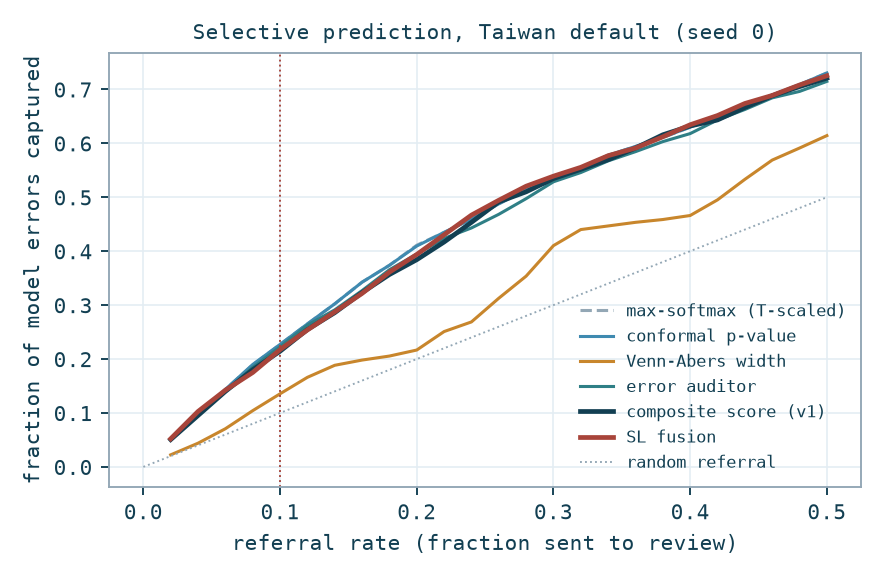
If a person can only look at 10% of decisions, which 10%? Each row ranks decisions by one signal and refers the least reliable 10%. The columns say how many of the model's errors, and how many of its wrong approvals, land in that 10%. Random referral captures 10% by construction. AURC is the error rate averaged over every possible referral rate; lower is better.
| Signal (Taiwan) | Errors caught at 10% referral | Wrong approvals caught at 10% referral | AURC (lower is better) |
|---|---|---|---|
| MSP (T-scaled) | 0.2317 ± 0.0099 | 0.1719 ± 0.0098 | 0.0958 ± 0.0032 |
| Conformal p-value | 0.2315 ± 0.0099 | 0.1719 ± 0.0098 | 0.0958 ± 0.0032 |
| Venn-Abers width | 0.1269 ± 0.0119 | 0.0782 ± 0.0108 | 0.1468 ± 0.0041 |
| Error auditor | 0.2309 ± 0.0068 | 0.1831 ± 0.0100 | 0.0983 ± 0.0020 |
| Composite score (v1) | 0.2173 ± 0.0042 | 0.1592 ± 0.0042 | 0.1028 ± 0.0016 |
The composite is a weighted blend of the other rows, so its weights are a design choice, not a ceiling; on stable data the components it adds carry no information, which is why it trails. It ranks a queue and never routes a decision. The repository also reports a second advisory combination of the same signals; it ties with confidence within noise on Taiwan and trails it on German.
ShowHide Speed: how long the evidence record takes per decision
The full path (model, guaranteed set, bracket, input check, second model) takes a median of 8.0 ms per decision with 7,500 calibration rows, on ordinary hardware. The table repeats the measurement with larger calibration sets. At a million rows one component, the probability bracket, takes 96% of the time; a faster implementation exists and is measured only once a test shows it returns the same brackets.
| Component | 7,500 rows | 100,000 rows | 1,000,000 rows |
|---|---|---|---|
| conformal set and p-value | 0.02 | 0.11 | 1.10 |
| Venn-Abers interval | 2.19 | 31.59 | 472.35 |
| kNN distance, exact index | 1.05 | 2.21 | 10.47 |
| kNN distance, HNSW index | 0.08 | 0.09 | 0.10 |
| martingale update | 0.01 | 0.01 | 0.01 |
| full envelope (with model, exact kNN) | 8.46 | 40.99 | 492.51 |
B. Beyond the two datasets exploratory
The same code was run, under a plan written before any download, on data nobody at Reliax chose. These runs are exploratory: they change no threshold and no claim above.
ShowHide 4.7 million US mortgage decisions (HMDA 2025): the guarantee per group, on reported race and ethnicity
HMDA records whether each mortgage application was originated or denied, with the applicant's reported race, ethnicity and sex. The model predicts the lender's decision. With one threshold for everyone, coverage was 0.950 overall but 0.924 for Black applicants and 0.936 for Hispanic applicants against 0.956 for White applicants. Built per group, the guarantee was within 0.01 of target for every group large enough to measure. The share sent to a person still differed by group (24.2% of Black applicants against 14.5% of White applicants), because the model is least certain where denials are most common; the guarantee makes that visible and does not remove it. Guessing the group from the applicant's neighbourhood instead of the reported attribute misstated two of the six groups.
| Group (reported) | n test | Denial rate | Coverage, marginal | Coverage, per group | REVIEW rate |
|---|---|---|---|---|---|
| White | 131,236 | 0.129 | 0.956 | 0.950 | 0.145 |
| Asian | 13,116 | 0.127 | 0.949 | 0.952 | 0.084 |
| Black or African American | 17,342 | 0.255 | 0.924 | 0.949 | 0.242 |
| American Indian or Alaska Native | 1,368 | 0.228 | 0.941 | 0.951 | 0.204 |
| Race not available | 30,755 | 0.211 | 0.941 | 0.950 | 0.186 |
| Hispanic or Latino (ethnicity) | 24,917 | 0.183 | 0.936 | 0.952 | 0.165 |
ShowHide Eight tasks outside credit (TableShift): the guarantee under shifts nobody at Reliax chose
In distribution, coverage was within 0.01 of target on all eight tasks. Under each task's shift, coverage fell on seven of eight and the share sent to a person rose on seven of eight. The outcome check flagged all eight. The input test caught most shifts and missed the largest: on one task the model became confidently wrong on a new school, the share sent to a person fell instead of rising, and only the outcome check saw it. That case is why no label-free signal is presented as sufficient. The input test also broke its false-alarm bound on one task with few calibration rows and many sparse columns; the fix is queued and will be measured before it is reported.
| Task (domain) and shift | Coverage, ID | Coverage, OOD | REVIEW rate, ID / OOD | OOD streams reaching ALARM | Calibration error, claimed / realised OOD |
|---|---|---|---|---|---|
| ACS income (finance) · region | 0.949 | 0.937 | 0.335 / 0.343 | 60% | 0.008 / 0.063 |
| ACS food stamps (public policy) · region | 0.949 | 0.943 | 0.290 / 0.326 | 100% | 0.007 / 0.015 |
| ACS unemployment (labour) · education | 0.948 | 0.926 | 0.040 / 0.059 | 100% | 0.001 / 0.002 |
| BRFSS diabetes (health) · race | 0.950 | 0.931 | 0.217 / 0.246 | 100% | 0.007 / 0.038 |
| Hospital readmission (health) · admission source | 0.949 | 0.961 | 0.740 / 0.820 | 100% | 0.014 / 0.040 |
| College Scorecard (education) · institution type | 0.946 | 0.848 | 0.015 / 0.039 | 100% | 0.003 / 0.020 |
| ASSISTments (education) · school | 0.950 | 0.590 | 0.027 / 0.010 | 40% | 0.007 / 0.308 |
| ANES voting (civic) · region | 0.946 | 0.928 | 0.313 / 0.341 | 0% | 0.014 / 0.063 |
ShowHide 92 weeks of real lending (Home Credit 2024): a real drift, and the repair
1.5 million dated decisions, January 2019 to October 2020. Coverage held at 0.953 through 2019, fell to 0.936 in February and March 2020 while the realised calibration error doubled, then recovered when the applicant pool changed again. Eight weeks after the drift was flagged, recalibrating the guarantee without waiting for outcomes recovered about a quarter of the loss; recalibrating on four weeks of landed outcomes recovered 94% of it. The model was untouched throughout.
| Month | Decisions | Coverage | Realised calibration error |
|---|---|---|---|
| Dec 2019 | 126,011 | 0.9533 | 0.008 |
| Jan 2020 | 86,750 | 0.9449 | 0.012 |
| Feb 2020 | 75,183 | 0.9359 | 0.017 |
| Mar 2020 | 60,748 | 0.9362 | 0.015 |
| Apr 2020 | 8,289 | 0.9664 | 0.008 |
| Sep 2020 | 61,905 | 0.9637 | 0.006 |
| Arm | Coverage | REVIEW rate | Share of the gap recovered |
|---|---|---|---|
| No repair | 0.9363 | 0.024 | |
| Weighted conformal, label-free (Tibshirani et al. 2019). Weights come from a domain classifier between the calibration window and the trailing 4 weeks. | 0.9394 | 0.020 | 0.22 to 0.24 |
| Recalibration on the trailing 4 weeks' own outcomes, which is what a recalibration ticket does once labels land. | 0.9492 | 0.007 | 0.91 to 0.96 |
ShowHide Early result: which decisions to review while a shift is under way (Taiwan, three runs)
When one decision in four came from a population the model had not seen, reviewing the inputs the guarantee did not cover first caught 2.15 times the bad approvals of random review, against 1.34 for the model's confidence: 1.6 times more. When 5% of inputs carried a currency error on monetary fields, that rule caught all of them and confidence caught 1%. On stable data the same rule trails confidence. This is one dataset and three runs, not pre-registered; a benchmark with its pass mark fixed in advance decides whether the rule ships.
C. Reproducibility and references
The package is public at github.com/reliax-io/reliax-evaluation, with the code for every experiment. The two credit datasets ship with it (UCI, CC BY 4.0); the annex B data is fetched by script where the source is public and instructions-only where the licence forbids redistribution. The results of sections 2 to 4 reproduce exactly from a clean clone: one script runs every experiment in about two minutes, with splits, seeds and thresholds fixed in code. Section 5 is run by eval/run_confirmatory.py and eval/run_production.py; its two datasets are fetched from Kaggle by script (data_gated/fetch_confirmatory.py), never redistributed, and the checksums of the files read are recorded with the results. Environment: Python 3.14, scikit-learn 1.9, numpy 2.5.
- Angelopoulos, A. N., Bates, S. (2023). Conformal prediction: a gentle introduction. Foundations and Trends in Machine Learning, 16(4).
- Barber, R. F., Candès, E. J., Ramdas, A., Tibshirani, R. J. (2021). The limits of distribution-free conditional predictive inference. Information and Inference, 10(2).
- Gibbs, I., Cherian, J. J., Candès, E. J. (2023). Conformal prediction with conditional guarantees. arXiv:2305.12616.
- Gardner, J., Popovic, Z., Schmidt, L. (2023). Benchmarking distribution shift in tabular data with TableShift. NeurIPS Datasets and Benchmarks.
- Guo, C., Pleiss, G., Sun, Y., Weinberger, K. Q. (2017). On calibration of modern neural networks. ICML.
- Hofmann, H. (1994). Statlog (German Credit Data). UCI Machine Learning Repository.
- Ovadia, Y., Fertig, E., Ren, J., Nado, Z., Sculley, D., Nowozin, S., Dillon, J. V., Lakshminarayanan, B., Snoek, J. (2019). Can you trust your model's uncertainty? Evaluating predictive uncertainty under dataset shift. NeurIPS.
- Tibshirani, R. J., Barber, R. F., Candès, E. J., Ramdas, A. (2019). Conformal prediction under covariate shift. NeurIPS.
- Ville, J. (1939). Étude critique de la notion de collectif. Gauthier-Villars.
- Vovk, V. (2012). Conditional validity of inductive conformal predictors. Proceedings of the Asian Conference on Machine Learning, PMLR 25.
- Vovk, V., Gammerman, A., Shafer, G. (2005). Algorithmic Learning in a Random World. Springer.
- Vovk, V., Nouretdinov, I., Gammerman, A. (2003). Testing exchangeability on-line. ICML.
- Vovk, V., Petej, I. (2014). Venn-Abers predictors. UAI.
- Vovk, V., Petej, I., Fedorova, V. (2015). Large-scale probabilistic predictors with and without guarantees. NeurIPS.
- Yeh, I-C., Lien, C-h. (2009). The comparisons of data mining techniques for the predictive accuracy of probability of default of credit card clients. Expert Systems with Applications, 36(2).
D. A case: what if the training labels are wrong? exploratory · measured on Taiwan
Why it happens. In credit, the label a model learns from is rarely observed cleanly. "Default" is defined by a rule, such as 90 days past due, recorded months after the decision and sometimes from a proxy. Only accepted applicants ever get an outcome, so the training set says nothing about the ones who were refused. Definitions change over the years a training set spans, and some labels are simply entered wrongly. A model trained on such labels is worse than it looks, and nothing in its output shows it.
What we did. The paper's Taiwan protocol (same split, same model, five seeds), with the training labels corrupted and the calibration and test labels left clean. Two kinds of damage: a share of all training labels flipped at random, and a share of the defaults relabelled as repaid, which is the realistic case of defaults that were never recorded. Added on 28 September 2026 after a reviewer's question; not pre-registered. Because this run uses the paper's own split rather than the shift benchmark's, its clean row differs slightly from the routing table in section 4.1.
| Training labels | Model accuracy / AUC | Model calibration error | Coverage | Review share | Bad approvals per 1,000, model alone → auto-decided | Share of bad approvals caught: guarantee / confidence cut, same rate | Auditor vs confidence, bad approvals caught at 10% referral |
|---|---|---|---|---|---|---|---|
| Clean labels | 0.821 / 0.777 | 0.013 | 0.952 | 49% | 142 → 48 | 0.66 / 0.66 | 18.3% vs 17.2% |
| 10% of labels flipped | 0.819 / 0.766 | 0.065 | 0.949 | 50% | 142 → 51 | 0.64 / 0.64 | 17.3% vs 15.2% |
| 20% of labels flipped | 0.818 / 0.754 | 0.127 | 0.949 | 51% | 147 → 51 | 0.65 / 0.65 | 18.8% vs 13.7% |
| 30% of labels flipped | 0.812 / 0.733 | 0.185 | 0.948 | 55% | 151 → 49 | 0.67 / 0.67 | 18.7% vs 14.9% |
| 30% of defaults hidden | 0.801 / 0.769 | 0.066 | 0.951 | 49% | 186 → 50 | 0.73 / 0.73 | 29.4% vs 19.6% |
| 50% of defaults hidden | 0.780 / 0.764 | 0.111 | 0.950 | 50% | 219 → 50 | 0.77 / 0.77 | 31.2% vs 29.8% |
What held. The guarantee held at every noise level: coverage between 0.948 and 0.952 against a 0.95 target, with a model that had learned from labels up to 30% wrong. The auto-decided part of the book stayed at about 50 bad approvals per 1,000 applications in every condition, while the model alone went from 142 to 219. That is the guarantee doing its work: it caps the error rate of what is decided automatically, whatever the training labels did to the model. And at the guarantee's own review rate, routing on the guarantee and a confidence cut caught exactly the same share of bad approvals in every condition, as the mechanism in section 3.2 predicts.
Where clean calibration data buys more. The auditor, the small second model trained on the clean calibration outcomes to predict where the base model is wrong, is where the extra detection appears. At a 10% referral it caught 18.8% of bad approvals against 13.7% for confidence with 20% of labels flipped, and 29.4% against 19.6% with 30% of defaults hidden; on clean labels the gap was 18.3% against 17.2%. At the guarantee's own review rate, about half the book, the two converge. The auditor is advisory: it orders a queue and never routes a decision.
The bracket stayed calibrated where the model was not. Its calibration error was between 0.016 and 0.021 in every condition. The standard fix repaired the flipped-label case but not the hidden defaults, because that damage is a one-sided bias, not a matter of scale.
| Training labels | Model's own probabilities | Temperature scaling | Bracket |
|---|---|---|---|
| Clean labels | 0.018 | 0.013 | 0.021 |
| 10% of labels flipped | 0.066 | 0.012 | 0.017 |
| 20% of labels flipped | 0.128 | 0.014 | 0.016 |
| 30% of labels flipped | 0.185 | 0.016 | 0.016 |
| 30% of defaults hidden | 0.069 | 0.037 | 0.018 |
| 50% of defaults hidden | 0.113 | 0.054 | 0.017 |
What the guarantee could not see. With half of the defaults hidden, the model became confidently wrong in one direction: it predicted default for 0.3% of applicants. The guarantee still held the auto-decided bad approvals at 50 per 1,000 by routing the low-confidence approvals to a person, but its review share did not rise, because the model's confidence pattern did not change. Telling the lender that the model has stopped seeing defaults is the job of the bracket, which showed it at once, and of the outcome check once outcomes land.
What it does not do. If the calibration outcomes are wrong too, the guarantee covers agreement with the recorded outcomes, not with the truth; this is why the calibration data has to be curated, not just sampled. Reliax does not repair the model: a model trained on bad labels stays a weak model. And this is one dataset, five seeds and synthetic noise; a run on a lender's real labels is one of the evaluations we would like to do with a partner. Code: eval/run_label_noise.py; results: results/label_noise.json.
This is a first evaluation on public data. We are looking for partners to replay it on real decisions, in observe mode, with success criteria agreed in advance.
Email: contact@reliax.io